English version and some details below the image keep scrolling!
Inne spojrzenie na moją skromną kolekcje twitów z okresu 06-08 2017.
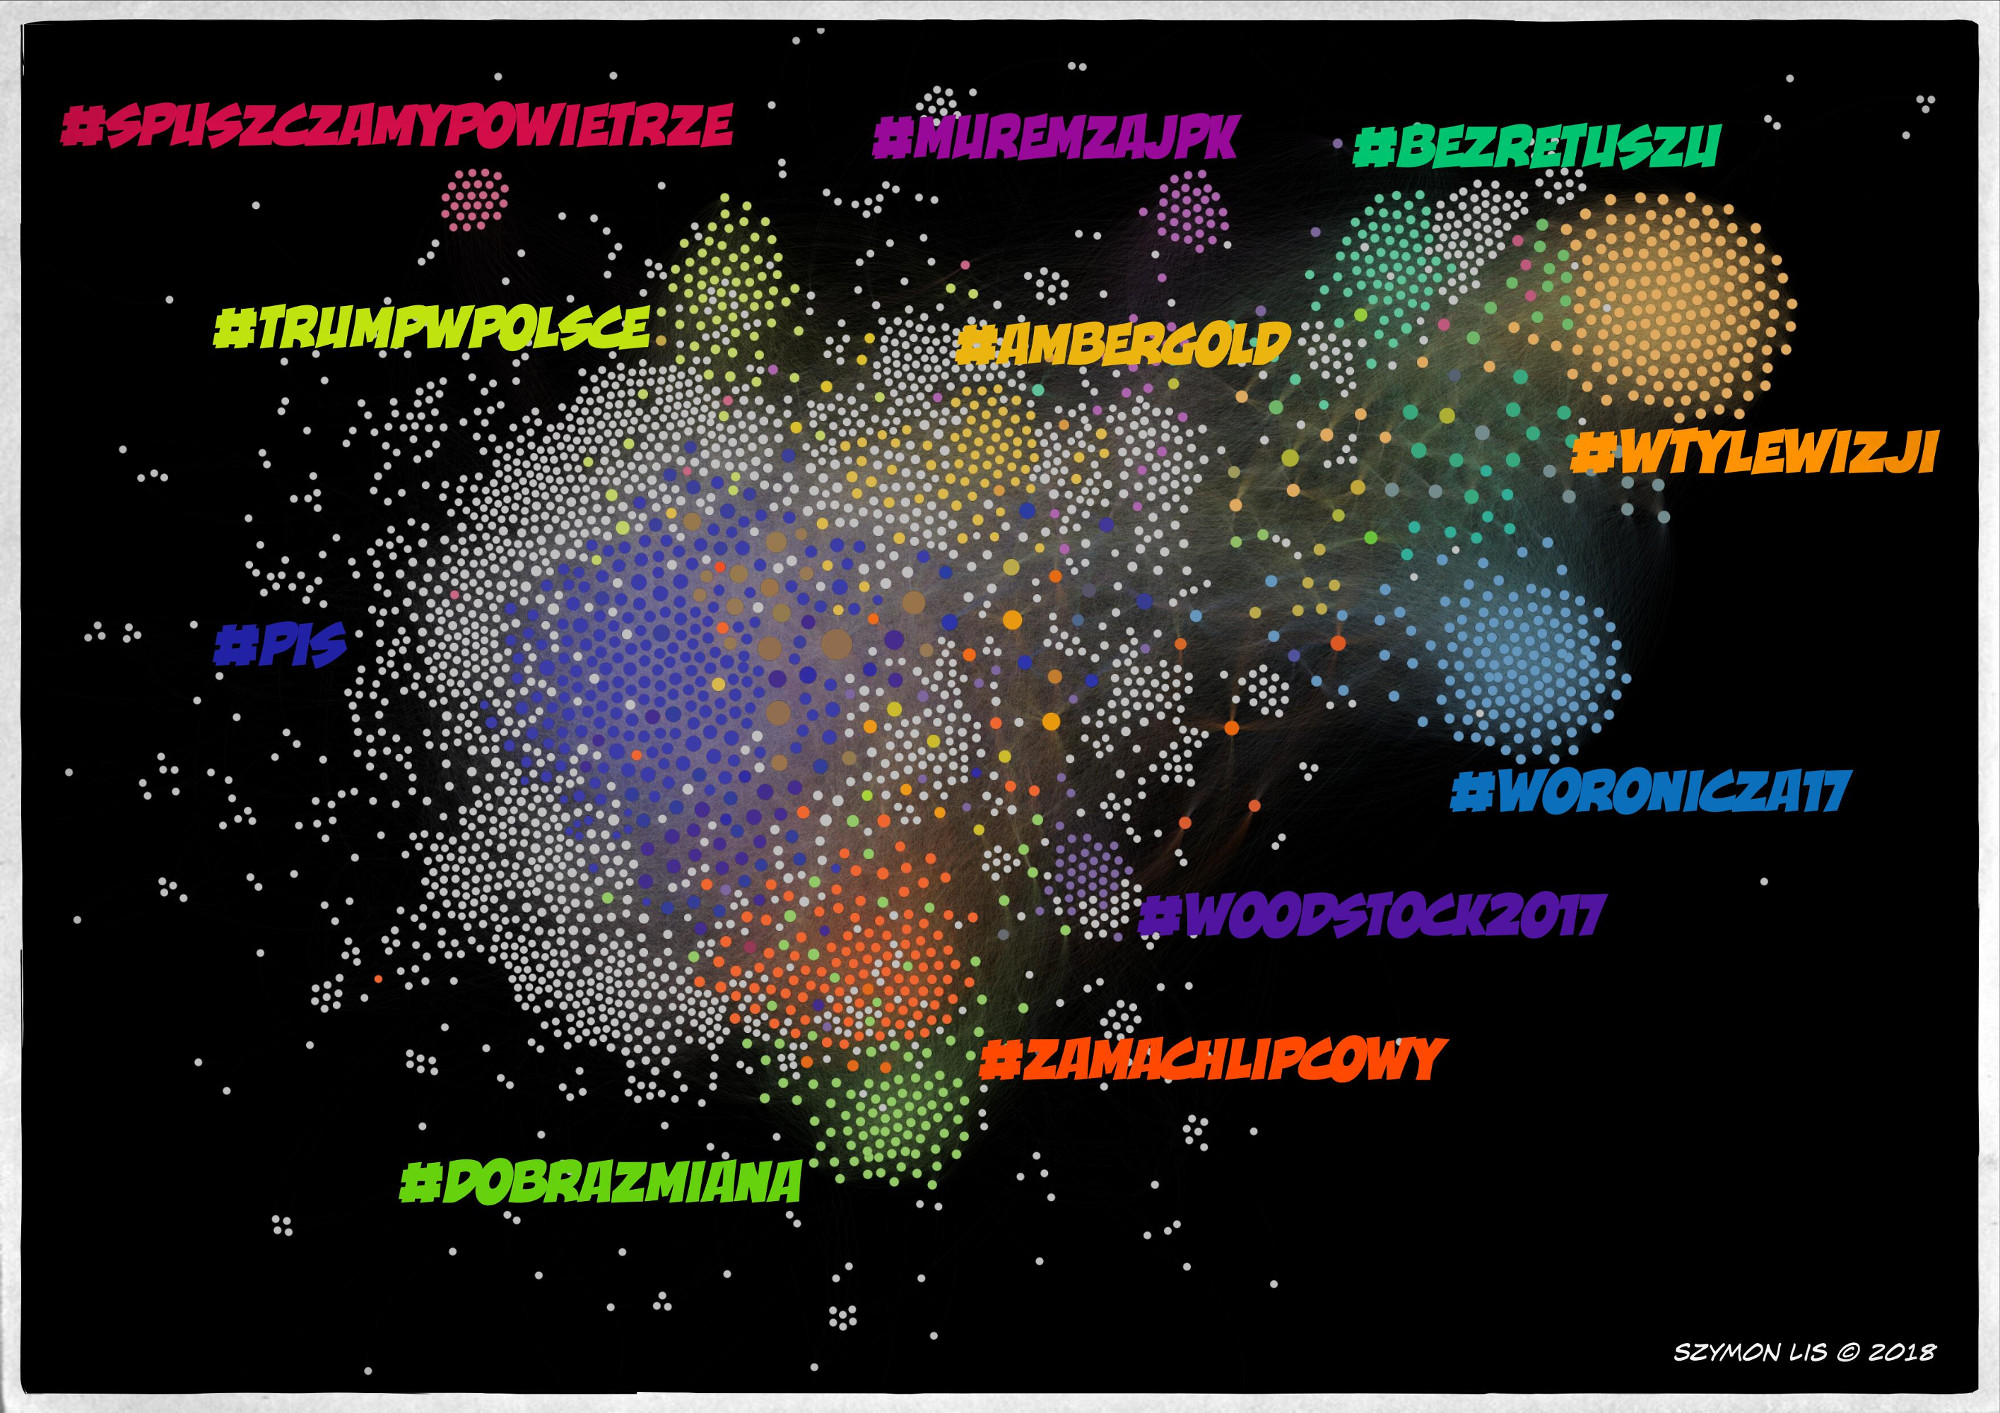
Wizualizacja przygotowana przy użyciu analizy grafów. Każdy punkt reprezentuje użytkownika twittera. Sięć połączeń jest wygenrowania na podstawie hashtagów. Użytkownik, który publikował twitta zawierającego danego hashtaga jest połączony z każdym użytkownikiem, który również publikował z użyciem tego hashtaga.
W rezultacie, użytkownicy publikujący przy użyciu wielu hashtagów będą łączeni z wieloma użytkownikami. Na wyżej przedstawionej ilustracji, ci użytkownicy znajdują się w środkowej części grafu, gdzie bardzo ciężko wyróżnić odizolwane klastry punktów.
Po drugiej stronie tego spektrum, są użytkownicy którzy używają tylko ograniczonej ilości hashtagów w swoich twittach. W tym przypadku powstaną odizolowane grupy użytkowników, którzy komunikją się tylko wewnątrz danego hashtaga. Na zamieszczonej ilustracji, przykładem takich grup są klastry: #wtylewizji i #woronicza17.
Wykorzystane narzędzie :
- Python, Numpy, Pandas,
- Gephi, www.gephi.org
English version
The second look at my twitter data. This time I used the graph network analysis to see connections between twitter users. Each node in the graph represents a twitter user, the edge between users is created if two users publish something using the same hashtag.
If someone uses many hashtags on regular basis it will be connected to many others twitter users. This is the case for node (users) in the middle of presented graph, which are packed together and it is hard to isolated them from others.
On the other side, there are users who publish usually for one or small number of hashtags. These users will create sort of clusters, as the communication happen only between them. See #woronicza17 and #wtylewizji group as an example.
Tool used to get the results :
- Python, Numpy, Pandas,
- Gephi, www.gephi.org